

Straits Times celebrated print journalism — and Taylor Swift — with innovative mega-infographic
Ideas Blog | 27 October 2025

Taylor Swift fans have managed to inject a new level of interest in vinyl records and beadshops — but could they do the same for print newspapers?
The Straits Times, Singapore’s newspaper of record, bet “yes” with our nine-part Taylor Swift infographic project, published to coincide with Swift’s Eras Tour March 2024 concerts in Singapore.
Each of the nine infographics covered one of the nine Taylor Swift albums highlighted during the Eras Tour, and then the graphics came together to form a collectable mega-poster of Swift.
The initial idea was conceived in November 2023 by Jeanmarie Tan, deputy editor of the lifestyle desk. She was inspired by the euphoria with which local fans had greeted all Singapore-related news of the Eras Tour, from the concerts’ ticket sales to screenings of the Eras Tour movie.
Additionally, Swift’s tour had already grossed US$1 billion, and she was experiencing a surge in popularity that felt like a once-in-a-generation cultural moment. It made sense for our coverage to be similarly enterprising.
Reaching a fanbase
As a lifestyle correspondent and self-declared Taylor Swift reporter, I took on the job of conceptualising and executing this idea. I was joined in this by my colleague Billy Ker, who sits with our paper’s art desk as an infographic designer and artist.
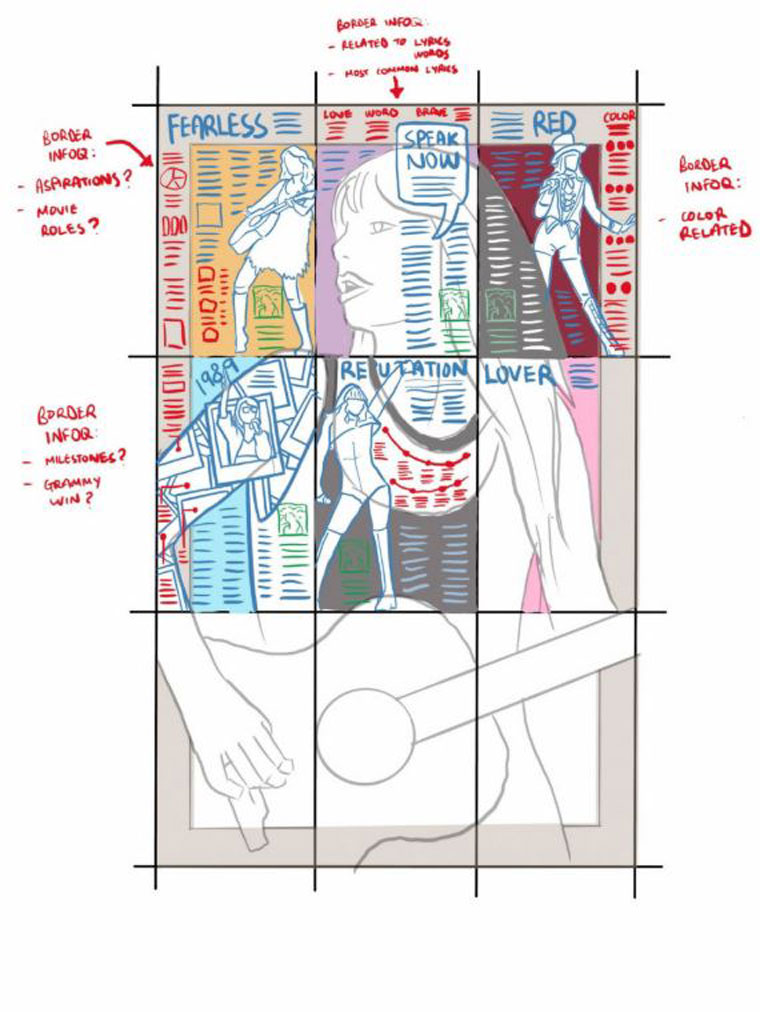
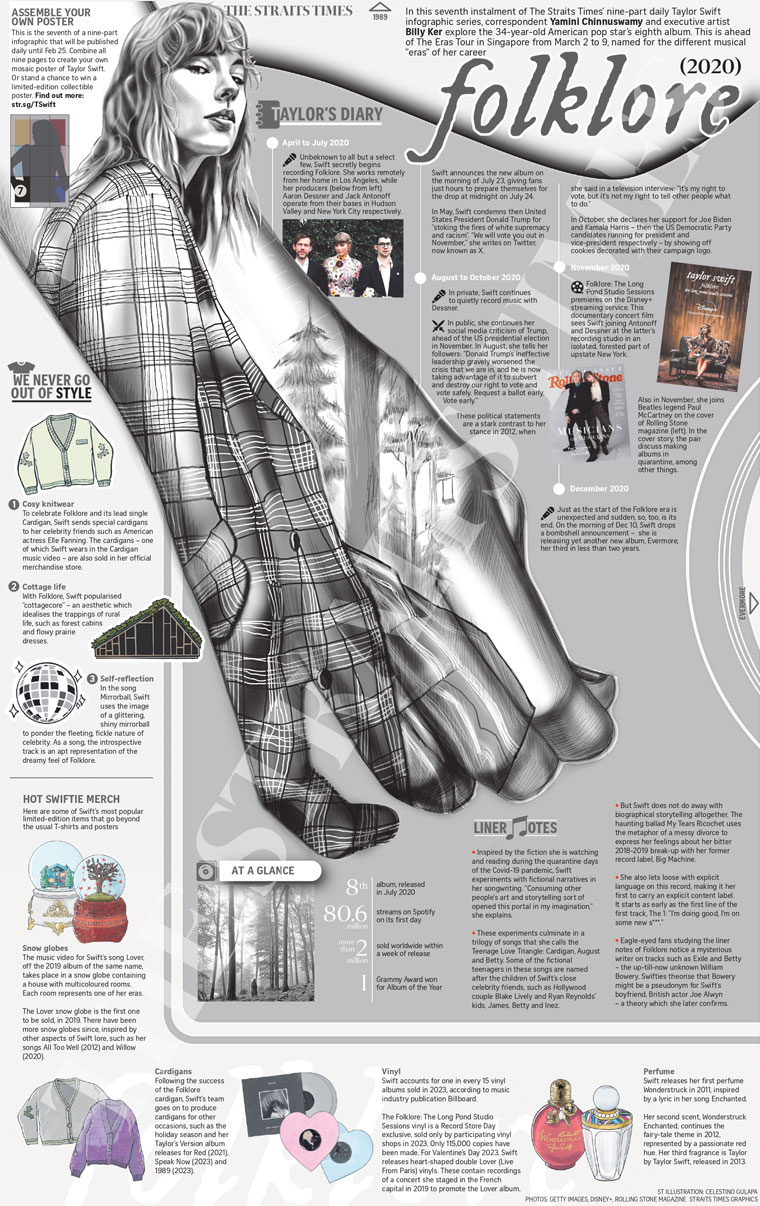
We were conscious that these infographics should not be a prettier version of a Wikipedia article. Instead, they had to leverage the visual language of infographics to report and reflect on Swift’s role and influence in pop culture since her breakthrough in the mid-2000s. They had to editorialise her career and impact in a way that would be accessible to our general readership but also fun for Swift’s dedicated fanbase to read.
So instead of just listing out the aesthetic features of each musical era, why not show them through motifs? For instance: a red scarf for the Red album and era — a tribute to the red scarf that Swift sings about in “All Too Well” on that album.
We also dedicated the border space of the “mega-graphic” to data-focused “asides,” such as a mini-infographic that visualised Swift’s prolific use of colours in her songwriting.
Starting in February, we published one full-page infographic a day in the print edition of our newspaper, giving readers something new to look forward to over nine days.
Much of our younger audience lives on TikTok and Instagram, and does not follow us in print. To ensure that they did not miss out on the project, and to add a multi-media dimension to the print graphics, Alexis Flores, a motion graphics designer with our video team, produced animatics for each graphic.
When sharing these animatics on TikTok and Instagram, social media specialist Farzanah Friday added final “Swiftie” touches, such as era-appropriate music, to ensure that we piqued the interest of any passing Swift fans.
Friday also arranged for the thumbnails of the nine infographic posts to form a larger image on our TikTok and Instagram accounts. This was a homage to the print infographics, and a way of leveraging the “IG grid” layout that is popular among younger users.
To further heighten readers’ interest and investment in the infographic project, we also organised a giveaway, giving our readers a chance to win a poster print of the combined infographic. Anyone could enter; all they had to do was use and share a TikTok filter made by our team, using motifs from the infographics. These filters, which carried ST’s branding and livery, assigned users to their “Taylor Swift.”
Finally, in the final few days before Swift’s opening show in Singapore, we published PDFs of all nine graphics online so anyone from anywhere in the world could view and read them at their leisure on their device of choice.
A Swift(ie) response
The reception to the project was exceedingly positive. Swifties shared information about the project with international friends in online forums such as Reddit, and some enterprising readers even managed to sell their newspaper copies on online marketplaces to fans who missed out. Our collectable posters were also snapped up.
Print sales increased by more than 8,000 copies over the nine days that the graphics ran. We also registered more than 4,000 downloads of the soft copy PDFs.
And when the one-year anniversary of #ErasTourSG rolled around in March 2025, multiple fans made a point of highlighting the infographics and collectable poster in their retrospective posts on social media — showing The Straits Times was now a core memory of their Eras Tour experience.
Related Articles
-

The side door is the destination for young audiences
13 October 2026 -

5 lessons from the INMA Young Audiences Summit
28 September 2026 -

The 3 editorial pillars of Chile’s first streaming news channel
23 September 2026 -

AI’s effect on super user math
15 September 2026 -

What I told 40 CEOs (and won’t gatekeep from you)
30 August 2026 -

Economist launches subscription tier targeting younger audience...
20 July 2026 -

10 years later, user needs must be twinned with content formats...
1 July 2026 -

Bonnier News Local, Gota Media strike gold with their Core Mode...
21 June 2026
Upcoming Events
-

Subscriber Acquisition Master Class
10-17 November 2026
-

Media Advertising Summit
New York, United States
07-10 December 2026
-

AI-Native News Product Master Class
18-25 February 2027
-

Media Subscriptions Summit
Oslo, Norway
08-12 March 2027
-

World Congress of News Media
New York, United States
25-30 April 2027
-

Branded Content & Partnerships Master Class
20-27 May 2027
-

Subscriber Retention Master Class
17-24 June 2027
-

Conferencia Latinoamericana
15-16 July 2027
-

South Asia News Media Festival
New Delhi, India
19-22 July 2027
-

Asia/Pacific News Media Summit
19-20 August 2027
-

CEO Roundtable at Kilkenny
Kilkenny, Ireland
24-26 August 2027
-

Media Innovation Week
Amsterdam, The Netherlands
27 September - 01 October 2027