

Legit reviews content based on article clusters, audience insight
Content Strategies Blog | 10 September 2026

How often do you review your content strategy? Once a month, once a quarter, once a year? Or never at all?
At Legit, we do it every day, when we wrap up the day before. It’s an easy way to keep an eye on trends. But in the rush of fast-moving trends, it’s just as easy to lose sight of your main content pillars. So once or twice a year, we check our compass against the broader tastes of our audience.
It used to be that reviewing the strategy meant a manager going through the top articles of the last six to 12 months by hand. But how much can one person really check? Two-hundred articles? Five-hundred? Eight-hundred?
With the tools we have now, we can look at a far bigger pool of data — and make decisions that are actually objective. So, we built a script. It takes a huge pool of articles and clusters them. After that, we layer on extra features as we go.
On a bigger team, this is a job for a data analyst. But if you work in media, chances are you’re the data analyst too.
Step one: the data
The first thing we do is pull the data. Yours might live in Google Analytics, or wherever your numbers happen to sit.
We strip out articles tied to a one-off spike that won’t come round again — like a plane crash or Dua Lipa’s wedding. Left in, they only skew the whole picture.
The two things we never leave out are the headline and pageviews. Everything after that depends on where your traffic comes from. Ours leans on Facebook, so we pull in social interactions. If organic is your engine, you’d add click-through rates from Google or Discover instead. The combinations are endless.
Building the script
Once our data was clean, we built the script. We used Claude, though any alternative would do just as well. We won’t dwell on how to write it; language models do that brilliantly on their own. What mattered for us was being clear about what we wanted to achieve at the end.
We work with four Python libraries:
- Sentence-transformers reads and understands your article titles by meaning.
- BERTopic groups similar articles into clusters automatically.
- UMAP-learn cuts down the complexity so the clustering runs faster.
- HDBSCAN is the clustering algorithm underneath it all.
These are the ones that suited us, but not a fixed list. If something else matters for the job, it’s worth researching and swapping in.
Running the clustering
For the clustering itself, we use a BERT-based approach.
BERT is a language model. Think of it as a tool that reads text the way a person does — in context rather than word by word. It doesn’t just see the words in a headline; it works out what they mean together. “Apple” in a story about phones and “apple” in a recipe are the same word, but BERT can tell they aren’t the same thing. That’s what lets it spot which of our articles are really about the same topic, even when the headlines use completely different words.
In practice, the model reads all the article titles, turns each one into a set of numbers that captures its meaning — a “semantic vector” — and groups the similar ones together.
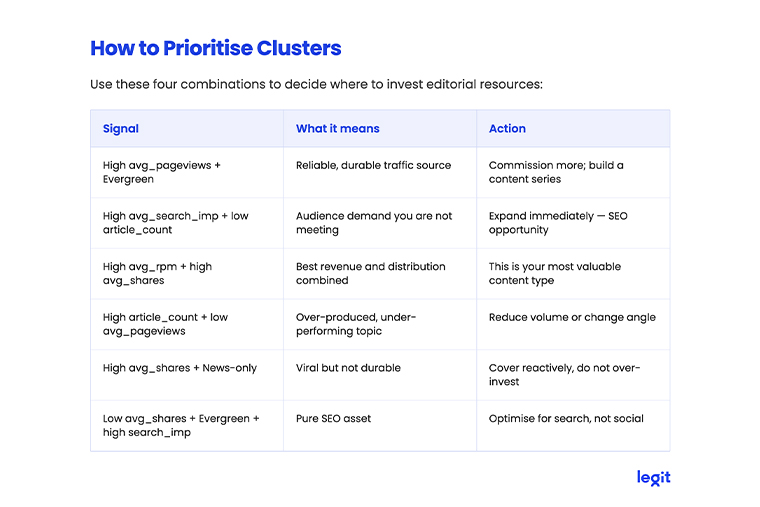
We get a lot of clusters. As a rule of thumb, the more articles a cluster holds and the higher its average pageviews, the stronger it is.
Then the script pulls a few example articles into each cluster — and this is the step we never skip. We read through them to make sure the clustering actually worked and that the groups make editorial sense.
Then we add performance metrics to each cluster: average pageviews, revenue per mille (RPM), shares, and search impressions.
Where the creative part begins
That’s where the basic data work ends and the creative part begins.
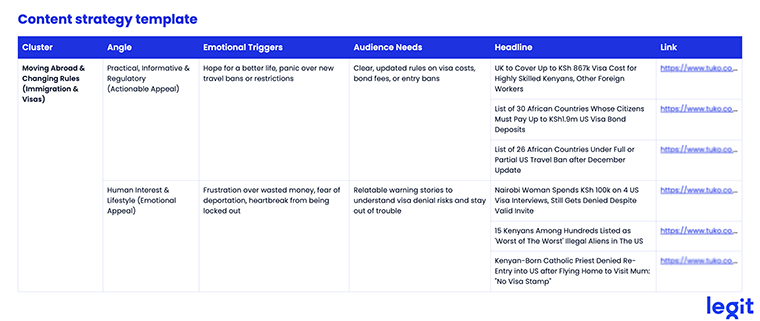
The more interesting bit is what else do we analyse?
- Audience need: What the reader actually wants (e.g. practical info, entertainment, curiosity, social validation, inspiration, etc.).
- Emotional trigger: The emotion that drives the click (e.g. fear, outrage, hope, pride, surprise, nostalgia, etc.).
- Evergreen: The shelf life of the content (evergreen, semi-evergreen, or news-only).
- Priority: How much to invest (high, medium, or low).
- Expansion ideas: Two or three specific story ideas to grow the cluster.
Separately, we look at the headlines that worked — and the hooks inside them.
How to prioritise your clusters
Now we have a table full of data. So, how do we decide what to act on first?
The step that matters most
Once we have a nice table, we could turn it into dashboards, presentations, chatbots — whatever our imagination stretched to.
But the most important step isn’t the clustering, and it isn’t a neatly written script. The most important step is getting the strategy across to your team, and making sure they agree with it and take it on board. Even the grandest strategy means nothing if it only matters to the manager.
We presented it to everyone, one group at a time. We also take feedback from everyone: the editor-in-chief, the heads of desk, and the teams. It stops being the manager’s strategy, and it becomes the newsroom’s. That’s the only kind that ever really works.
Banner image: Adobe stock image by SensSai/peopleimages.com.
Related Articles
-

At Mediacorp’s CNA, loyalty means giving audiences a reason to ...
20 August 2026 -

Tribun Network turns print “dots” into AI-powered insight
20 August 2026 -

Grupo RBS builds social-first video operation to expand audienc...
20 July 2026 -

Inside Denník N’s successful subscription strategy
15 July 2026 -

Why are audiences going to AI answer engines for news?
30 June 2026 -

Rheinische Post programme turns print loyalty into digital conf...
11 June 2026 -

With The B‑Side, Boston Globe scored an A+ with young audiences
10 June 2026 -

Audiences are reading less fact-based content yet newsrooms con...
25 May 2026
Upcoming Events
-

Subscriber Acquisition Master Class
10-17 November 2026
-

Media Advertising Summit
New York, United States
07-10 December 2026
-

AI-Native News Product Master Class
18-25 February 2027
-

Media Subscriptions Summit
Oslo, Norway
08-12 March 2027
-

World Congress of News Media
New York, United States
25-30 April 2027
-

Branded Content & Partnerships Master Class
20-27 May 2027
-

Subscriber Retention Master Class
17-24 June 2027
-

Conferencia Latinoamericana
15-16 July 2027
-

South Asia News Media Festival
New Delhi, India
19-22 July 2027
-

Asia/Pacific News Media Summit
19-20 August 2027
-

CEO Roundtable at Kilkenny
Kilkenny, Ireland
24-26 August 2027
-

Media Innovation Week
Amsterdam, The Netherlands
27 September - 01 October 2027